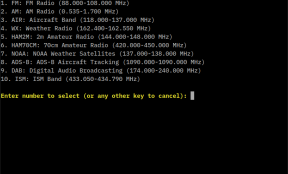
Updated on 2024/11/22 for version 1.0.1
After making the changes at the retrogram-rtlsdr project, i got the "virus" to make something even more better and in a language i know better, as C is not my thing. So Python it was, as it may not be the faster, but it has great support and anyone can contribute, as it is a well known programming language.
For sure, it needs some refinement and work some quirks, but it's functional and it has more than any other text based SDR project... at least, i know off. Just grab a copy and "play" with it. Get it at my Github repo... https://github.com/xqtr/PySpecSDR
Features:
- Real-time spectrum analysis and waterfall display
- Multiple visualization modes (spectrum, waterfall, persistence, surface, gradient)
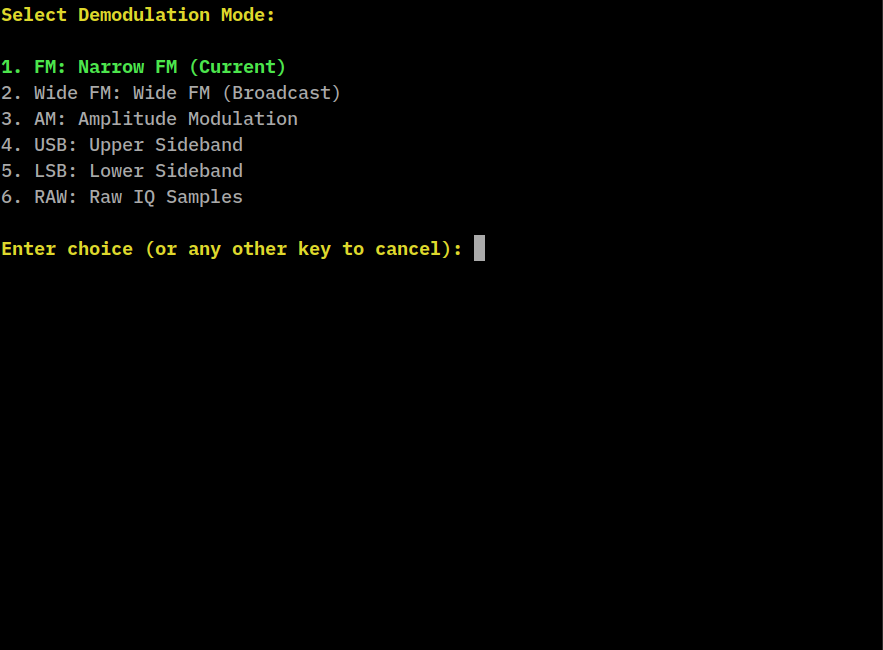
- FM, AM, SSB demodulation with audio output
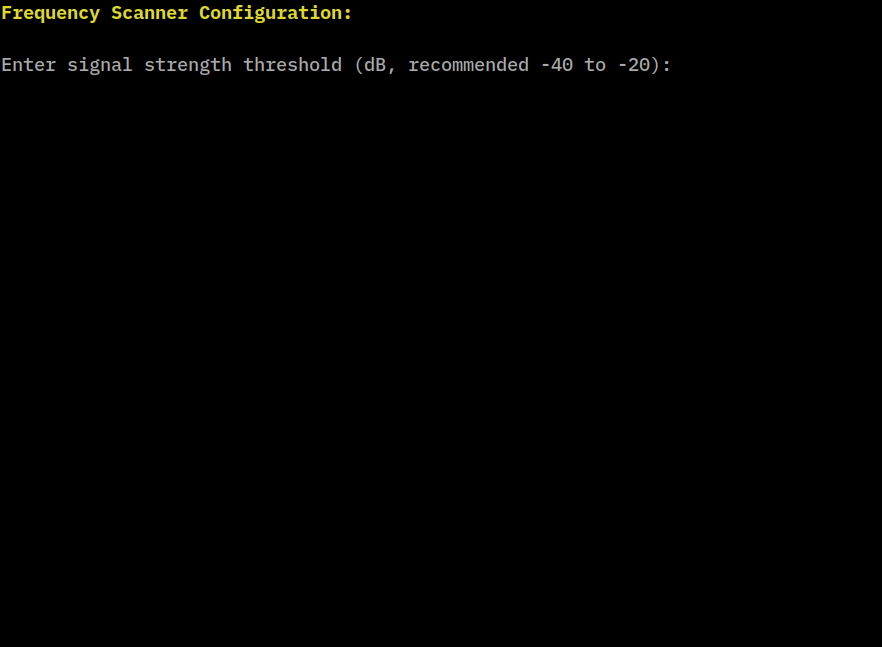
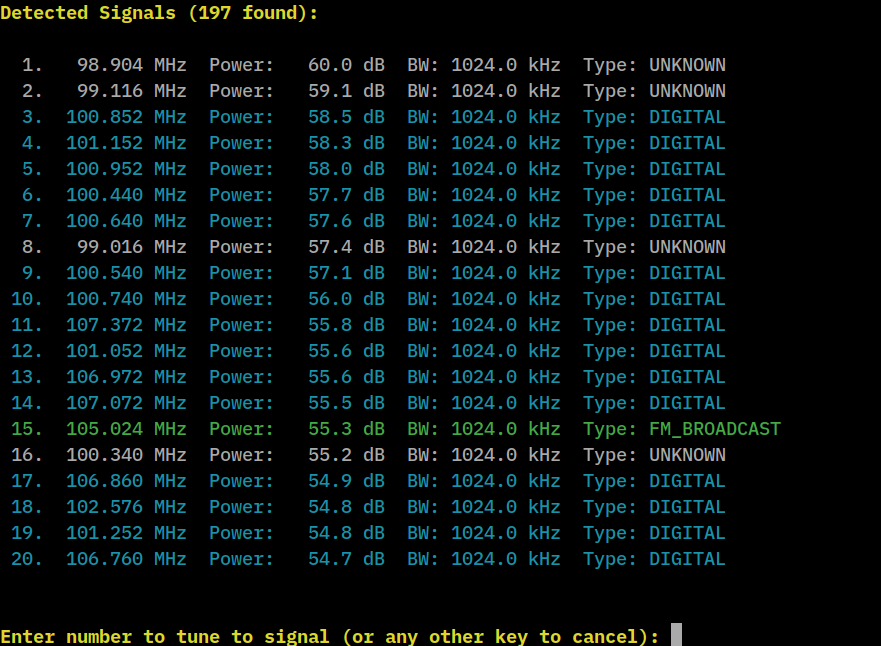
- Frequency scanning and signal classification
- Bookmark management for frequencies of interest
- Automatic Gain Control (AGC)
- Real-time Audio!
- Recording capabilities for both RF and audio
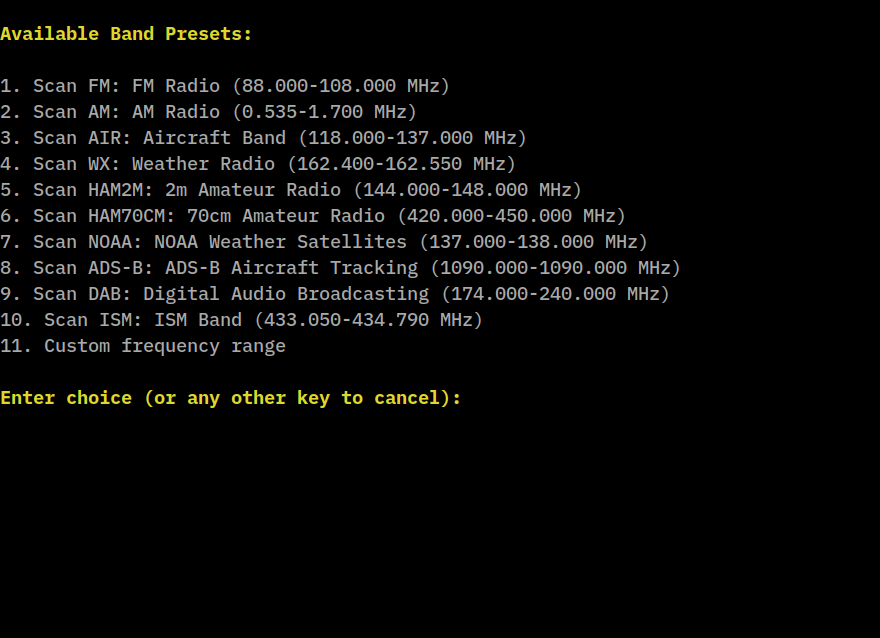
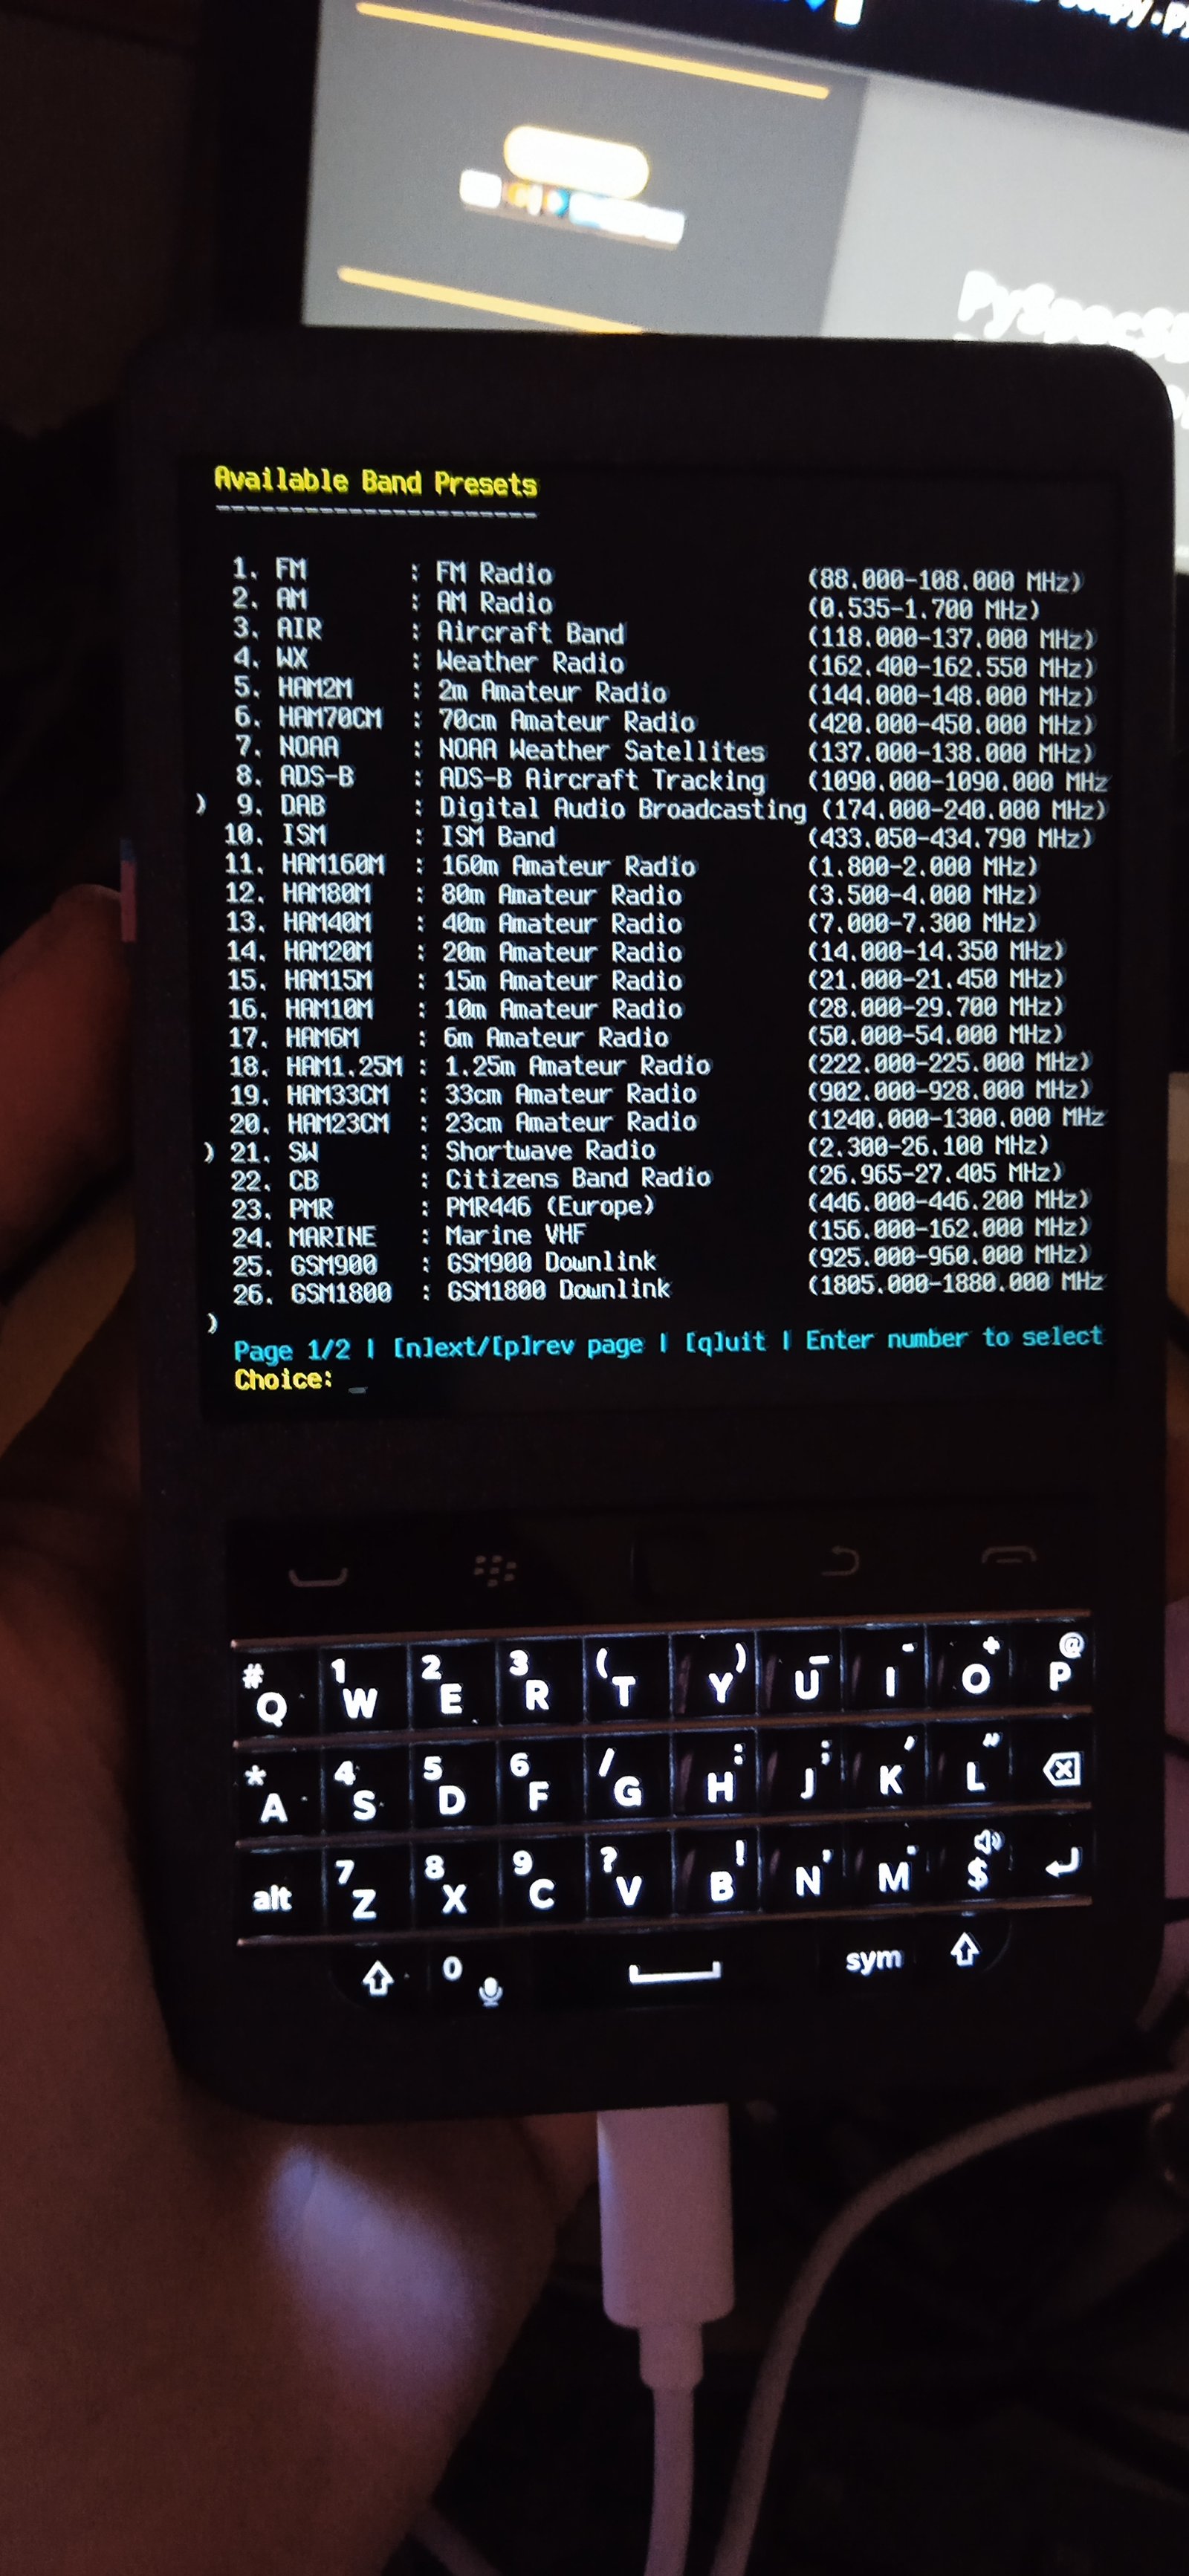
- Band presets for common frequency ranges
- Configurable display and processing parameters
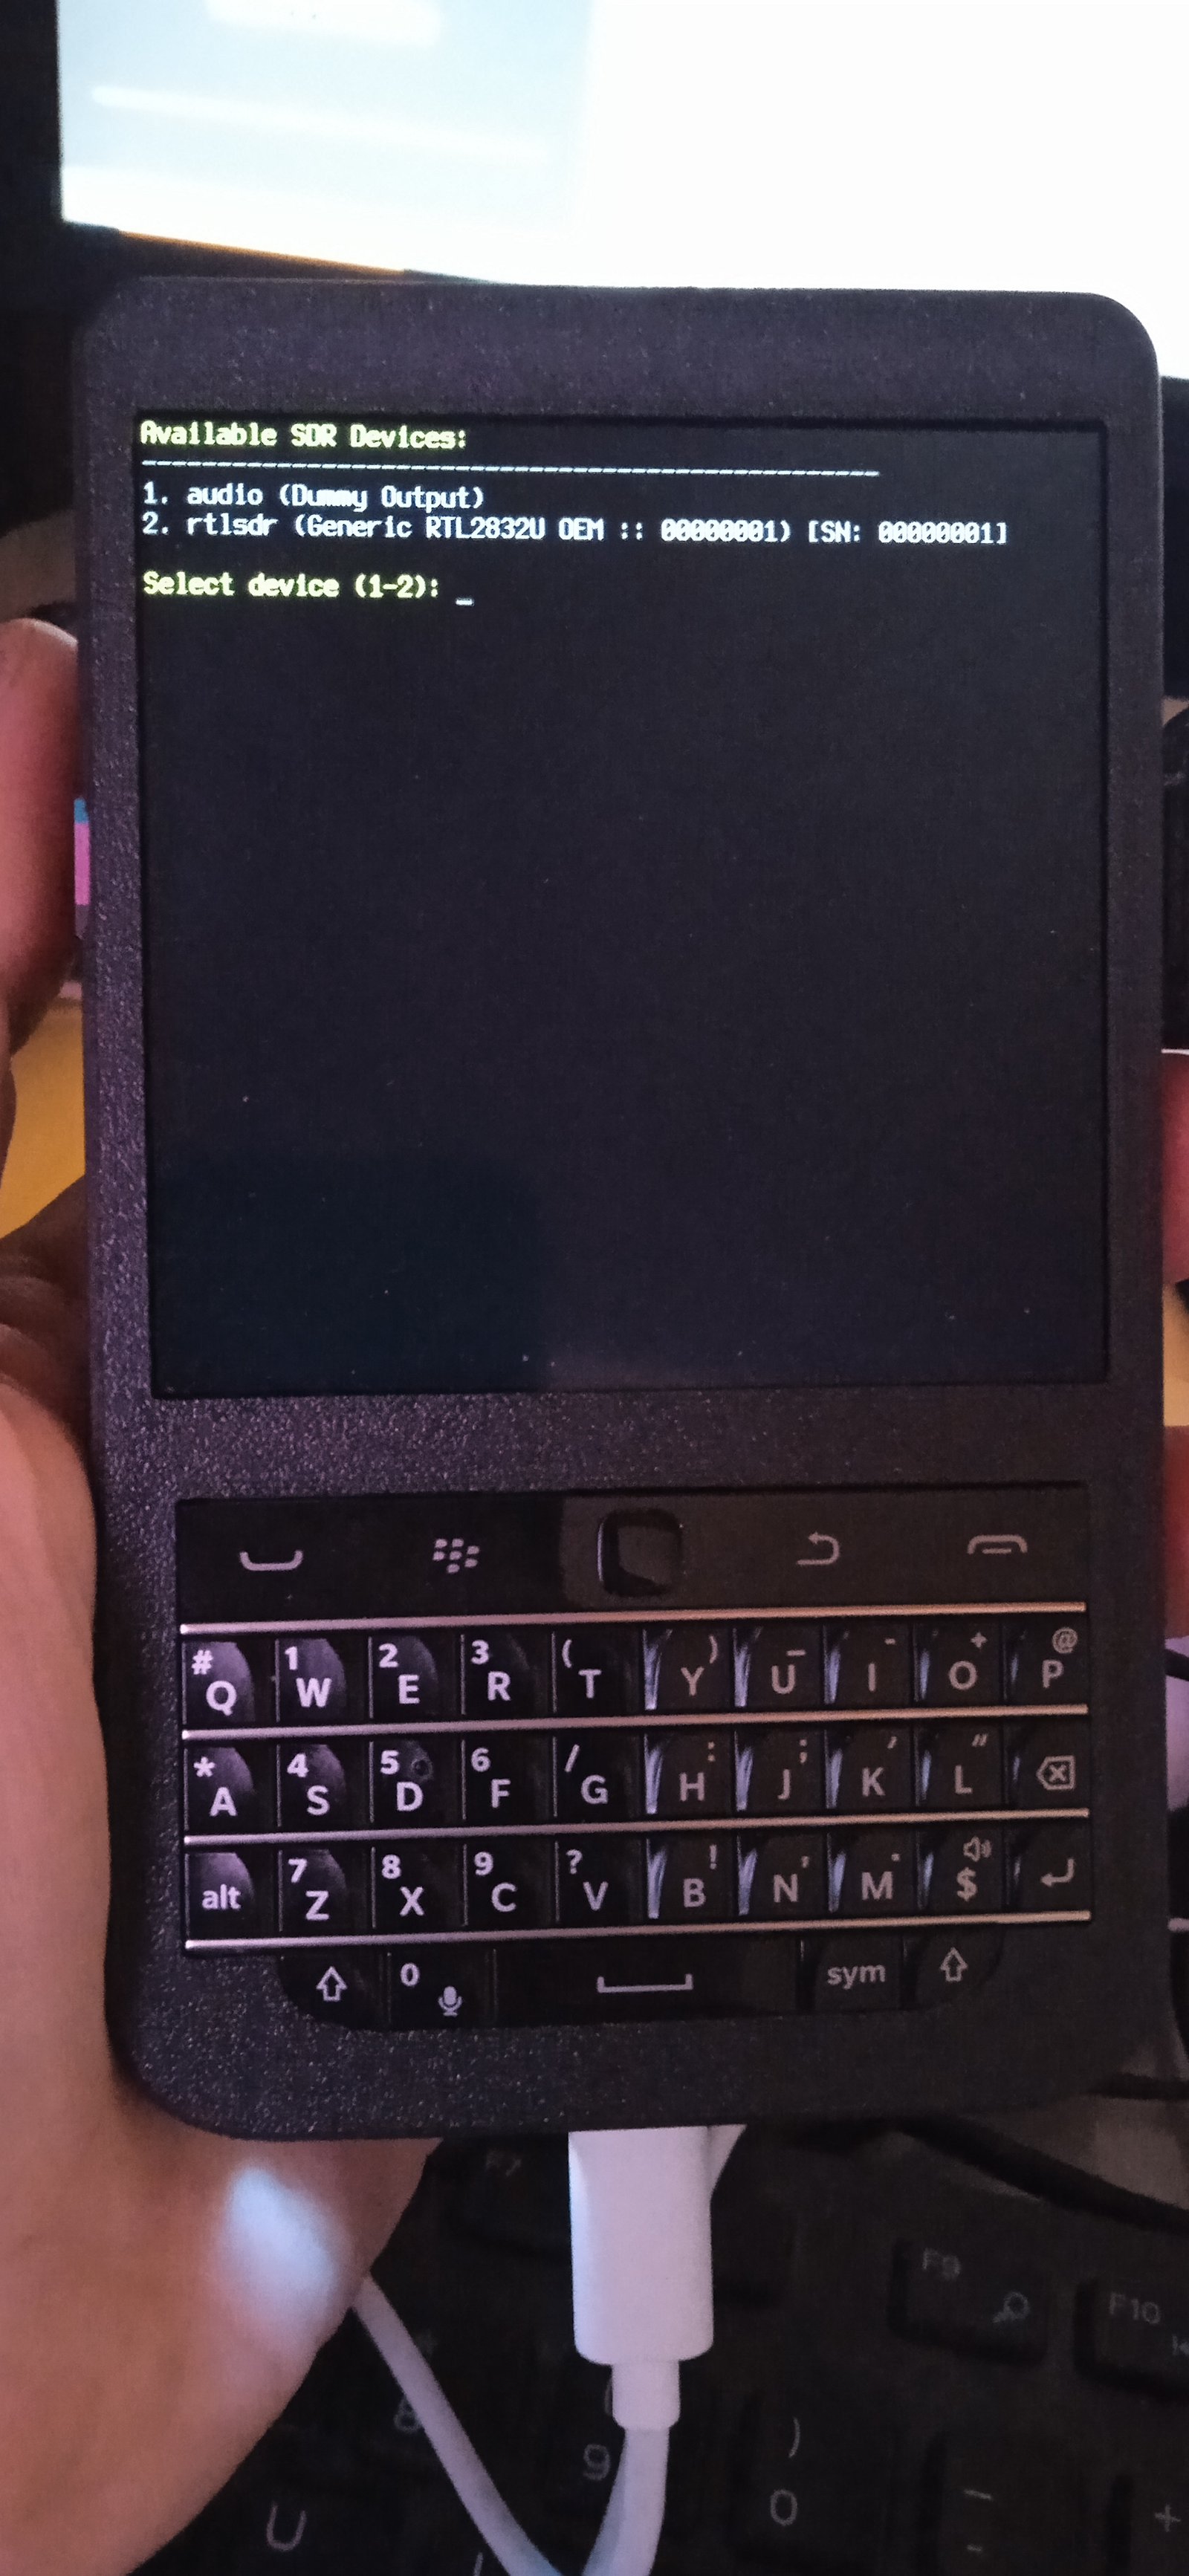
- SoapySDR support (2024/11/22)
Requirements:
- RTL-SDR compatible device
- Python 3.7 or higher
- Dependencies listed in requirements.txt
Installation
The installation process is for Raspberry Pi, Debian and Ubuntu, in other systems may vary.
Clone the repository with:
git clone https://github.com/xqtr/PySpecSDR
Install RTLSDR and SoapySDR libraries as well Python modules:
sudo apt update
sudo apt install -y \
    python3-pip \
    python3-numpy \
    python3-scipy \
    librtlsdr0 \
    rtl-sdr \
    librtlsdr-dev \
    portaudio19-dev \
    python3-dev \
    soapysdr-tools \
    python3-soapysdr \
    soapysdr0.8-module-rtlsdr
Depending your system and version of the OS, you may need other steps to ensure the USB RTLSDR dongle is visible to the system. Search for SoapySDR and/or RTL-SDR installation on Raspberry Pi to find updated info.
Showcase
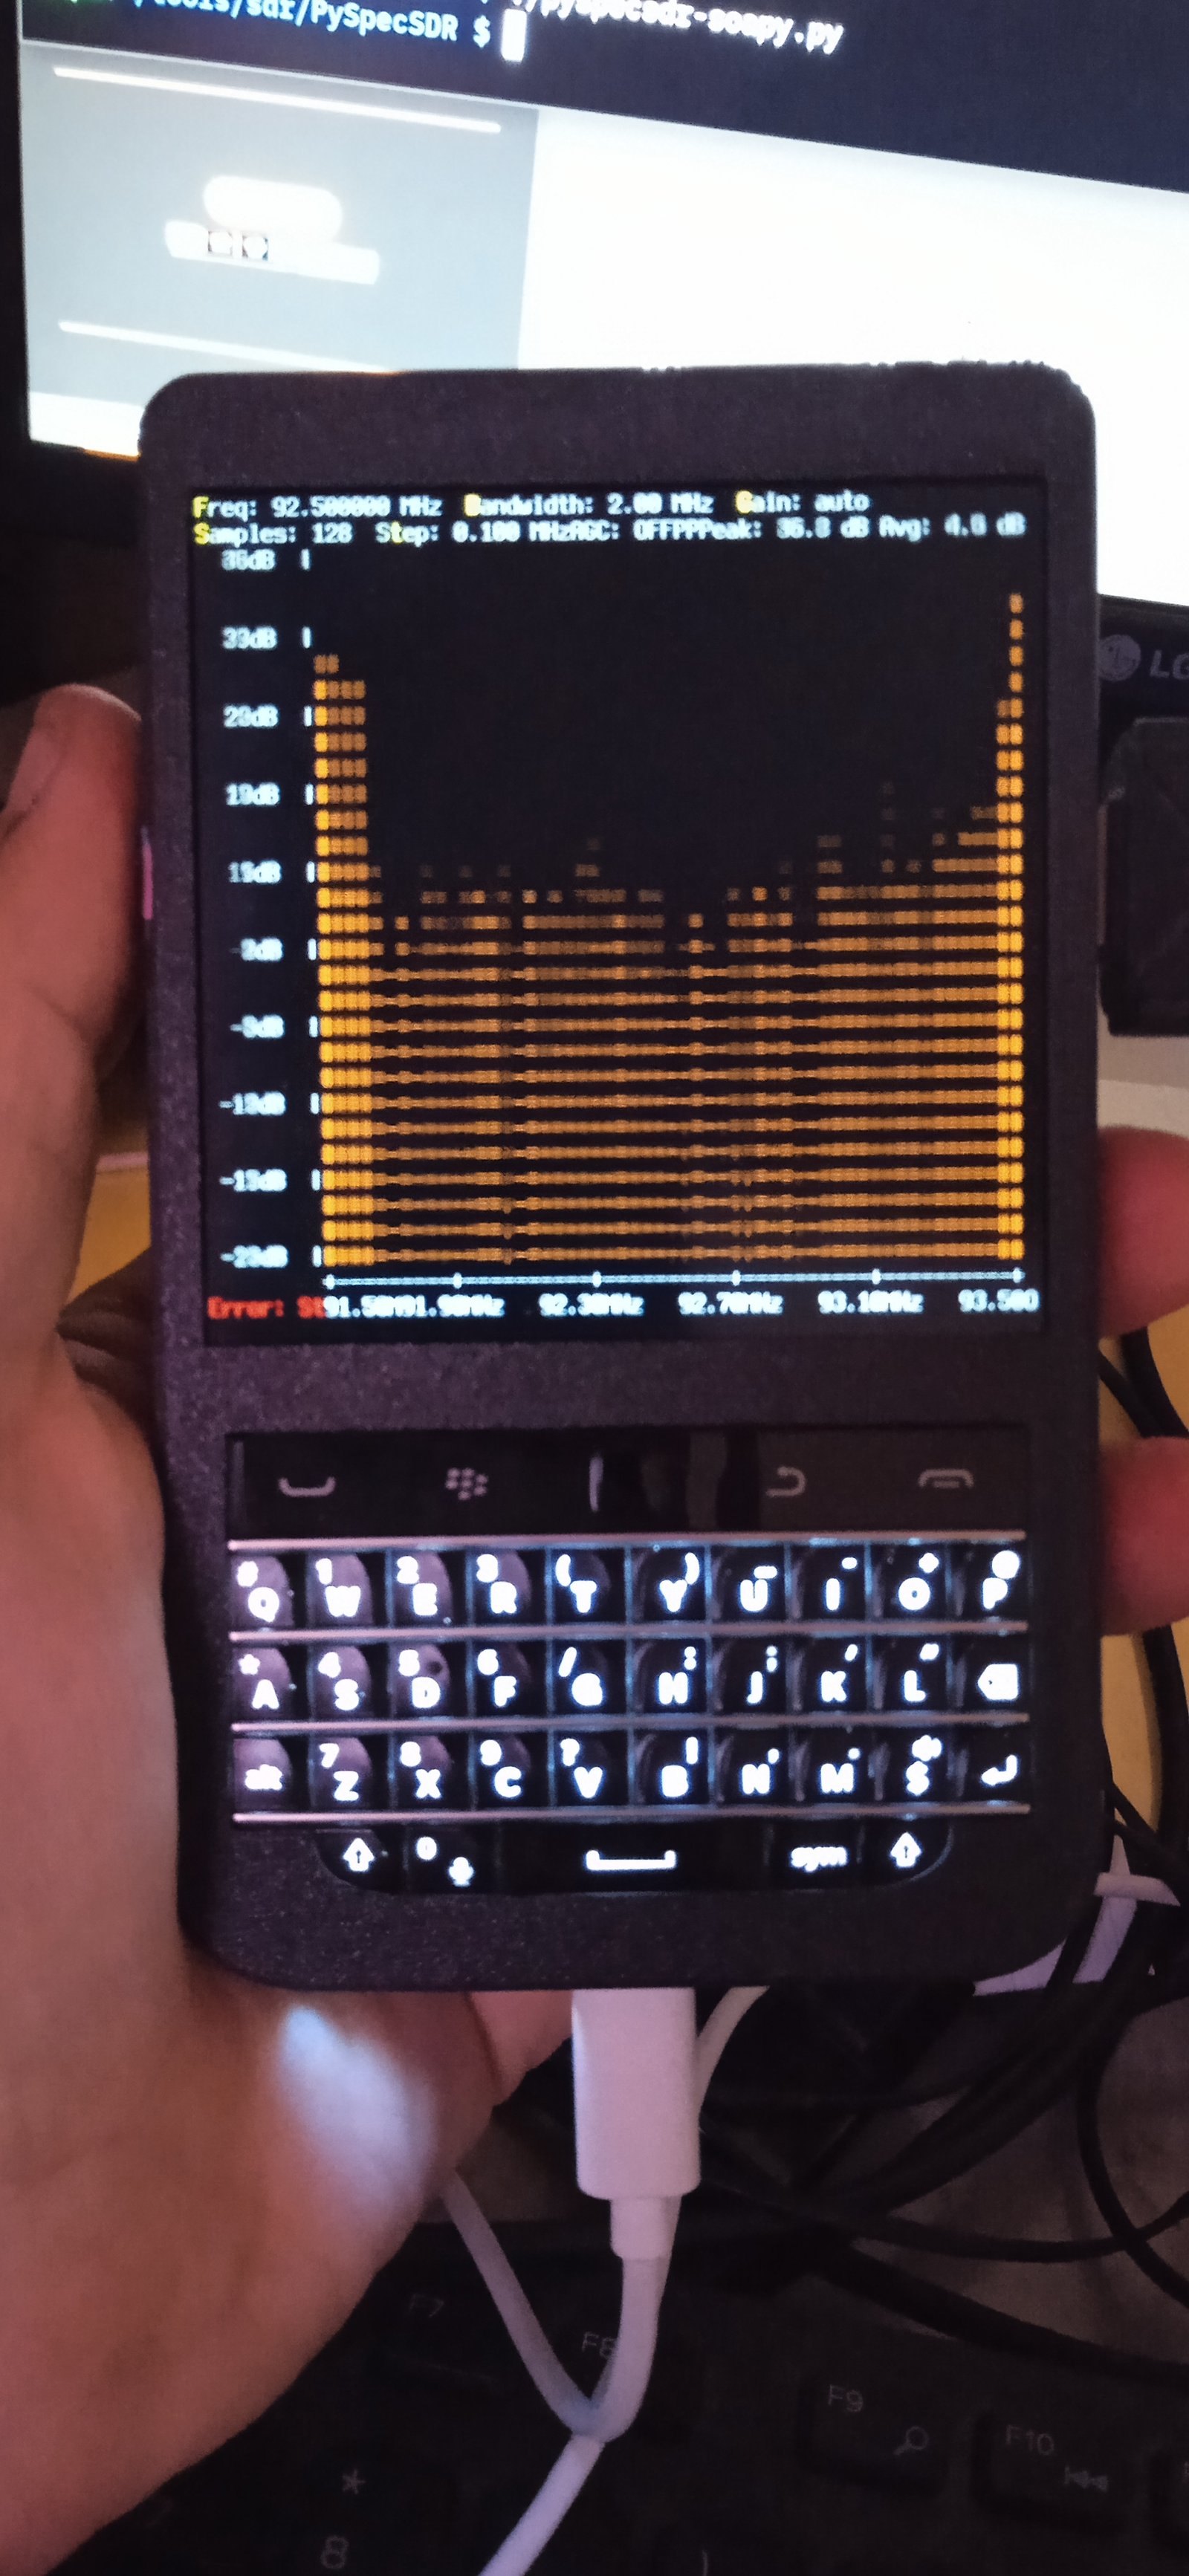

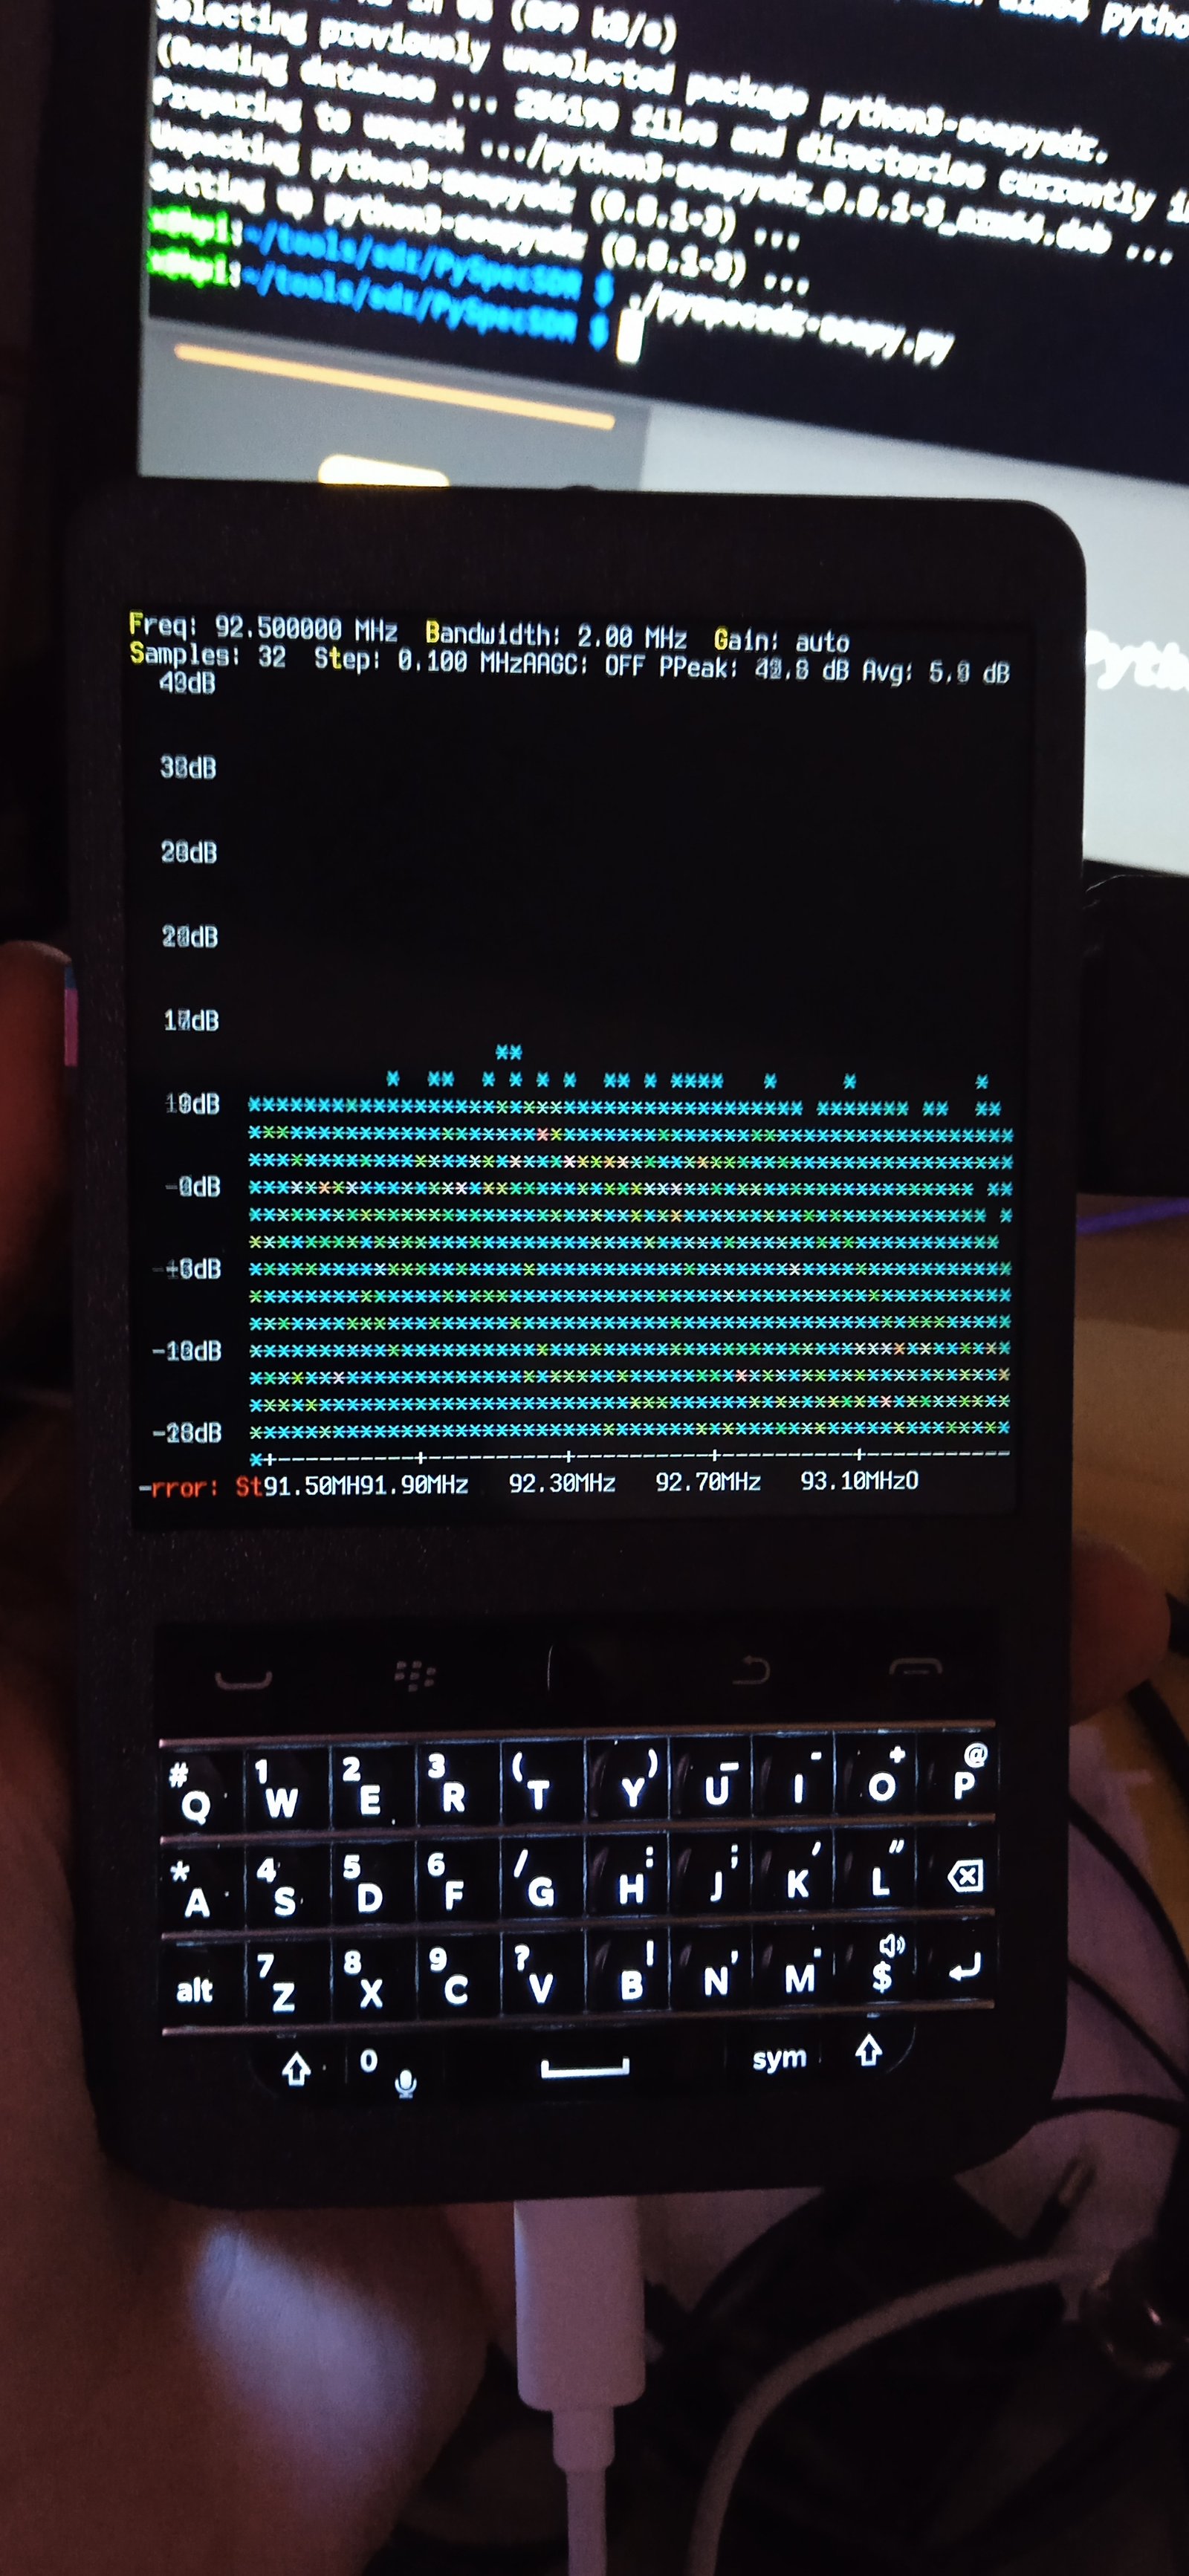

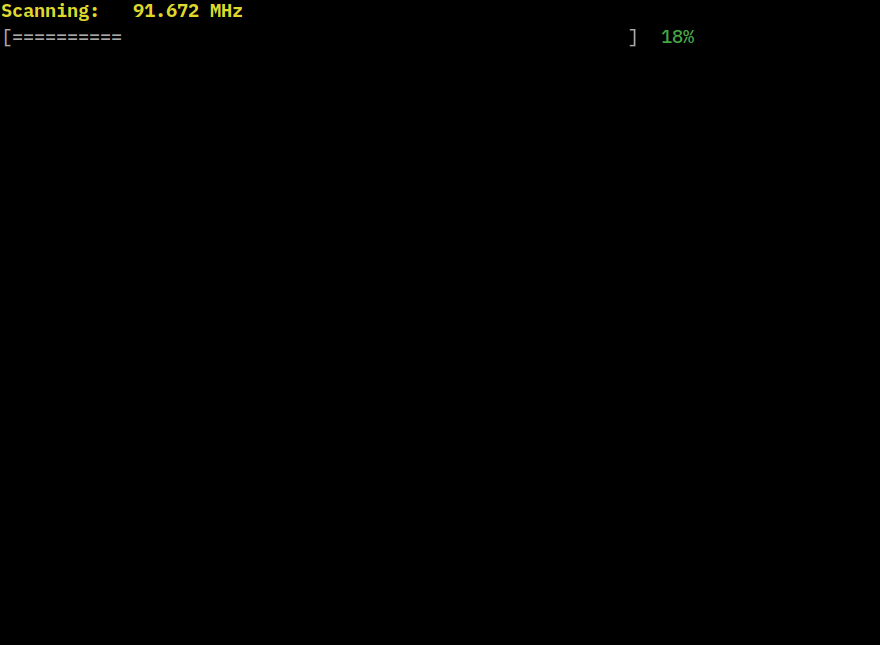
Scanning process...
